Observation Summary (Mainland China) 中国大陆/内地观测记录小结 - 2020APR03
(Last updated on: 2020-APR-06)
Foreword…
前言…
This post summarizes the butterfly observations uploaded to the corresponding iNaturalist project up to April 3rd, 2020. Only records from Mainland China is included for analysis (For other regions please click: Hong Kong, Taiwan. Macau is currently unavailable). We appreciated all members of the project, including all uploaders for sharing their data to the iNat platform. Special thanks to sunwenhao90 for his huge effort in identification.
这篇博文总结了截止2020年4月3日,用户上传到 iNaturalist 中国蝴蝶观测项目上的蝴蝶记录。以下总结只针对中国内地/大陆的数据,其他地区请点击:香港, 台湾(暂无澳门)。感谢所有分享过数据给iNat的用户,特别鸣谢 sunwenhao90 在鉴定上做的大量工作。
Distribution of the records through time
记录随时间的分布
Time of the observations 记录时间
Most observations are confined to the last five years—which is probably attributed to the popularity of high-quality cellphones and the popularization of iNat itself. Interestingly, we still get a small proportion of data from as early as the first 3 years of this century. Are such observation time accurate or misleading? Most observations were made during the warmer half of each year, as is shown distinctly by 5 peaks during every five-year interval.
大多数记录都成型于过去的五年中—应该有相当一部分归功于智能手机/相机的普及,以及 iNat 平台的不断成熟。有趣的是,我们仍然有少许21世纪头三年的记录,这些记录的时间信息会靠谱吗?此外,每个5年区间中都具有5个几乎等距的峰值,说明大多数记录都完成于每年中比较温暖的半年。

Time of the uploads 上传时间
The website iNaturalist was first launched back in 2008 as a final project of three students’ Master thesis. We see that the first butterfly record from Mainland China appeared around early 2013, 5 years after its birth. Large amount of butterfly data were generated mostly in the last three years. Although uploading observations reaches the peak usually in summer, there are also plenty of uploads within the recent winter.
iNaturalist 首次亮相是在2008年,最初来自于伯克利大学三位研究生的毕业论文。在中国大陆/内地的蝴蝶记录最早上传于2013年,也就是 iNat 诞生5年后。这个项目中绝大部分的记录都是由用户在过去3年内传至平台。虽然夏天时用户上传记录的数量最多,但最近的冬季里也有较可观的上传量。

Seasonality 季节性
Most butterflies are highly seasonal. We all enjoy watching groups of males puddling over the stream banks under the summer sun, but hardly can we find any (adult) butterflies in winter. How does that pattern vary across different butterfly families? To answer that question, the following figure plots the fraction of observations that are made each month against 12 months of a year. Larger radius means relatively higher number of individuals are observed during that time frame. Four seasons are colored as blue, green, red and orange, corresponding to winter, spring, summer and autumn. We see that:
- More observations are made in warmer months for all butterfly families (more active adults);
- Pieridae is the only family to peak not in summer;
- Papilionidae has a huge surge in summer but comparatively scarce around other times, especially, very few is observed in winter;
- Pieridae, Hesperiidae and Riodinidae all have a distinct winter “generation” around December to January. The essence of this generation is unclear, probably caused by records from the hotter areas;
- Lycaenidae shows very weak seasonal variation;
- Nymphalidae in general looks like Papilionidae, but it also has a small winter surge. It can be attributed to some overwintering adults occasionally been captured.
- It is highly naive to adopt such conclusion at any lower level of taxonomy, as they are only observed as an aggregate pattern across each family.
大多数蝴蝶都具有强烈的季节性。我们都熟知夏日高温下群蝶飞舞的场面,但在冬天就难以寻觅蝴蝶的踪影。不同科的蝴蝶的季节性有什么不同呢?下面这张图统计了每个科的蝴蝶在不同月份中的相对数量,即每个月的总观测量除以全年该科的观测总量。半径大的点表示相对数量较高。四个季节分别对应四种颜色(冬-蓝,春-绿,夏-红,秋-黄)。
- 对所有科而言,在温暖的月份中观察记录都更多;
- 粉蝶是唯一在夏天达不到相对数量顶点的科;
- 凤蝶在夏天发生量远大于其他时间,同时在冬季几乎毫无记录;
- 粉蝶、弄蝶和蚬蝶都似乎具有一个独特的冬季“世代”,这一“世代”的本质还不清楚,可能是由偏热带地区的记录导致的;
- 灰蝶整体的季节性弱于其他的科
- 蛱蝶整体而言和凤蝶相似,但冬季也有一个小范围的峰值,可能是因为某些冬季以成虫越冬的个体偶尔被发现所致。
- 因为这些结论是整个科合起来看才有,所以并不能向下套用在具体的种、属上。

Distribution of the records through taxonomy
记录在分类树上的分布
There are, to date, around 711 distinct butterfly species observed the Mainland China database. While the exact taxonomy is still debatable (e.g. whether Hestina nama should be Hestinalis nama), the overall distribution across the butterfly phylogeny is robust to such minor effect. We use the NCBI taxonomy as a backbone to generate the classification tree among 711 species, as shown in the following figure. (Heads-up: this is not a phylogeny.) To read the figure, each tip represents a unique species, and a multispecies genus is represented by a node at the second level. The phylogenetic relationship among families is omitted, and we still treat Riodinidae as a separate family, as opposed to treating it as a subfamily in Lycaenidae. The popularity of each species, i.e. the total number of observations per species, is plotted in the log-scale around the outter ring. Green = low number of records and Red = high number of records
截止今日,iNat数据库在中国大陆/内地的蝴蝶记录一共包含约711个物种。因为分类体系不同,精确的物种数量和关系很难统计(诸如蒺藜纹脉蛱蝶是否单独列属),但这不影响检视物种在分类系统中的分布。我们利用 NCBI 分类系统作为基本骨架搭建了如下图所示的物种间分类关系。为了简洁起见,种、属、科以外的分类单元全部不在其中(因此不是严格意义上的phylogeny)。每片“叶子”代表一个物种,有多个物种的属由第二层次上的一个节点表示,最中心的节点表示科。科之间的分类关系也被忽略不计,不过蚬蝶仍然被当成是单独的科以和 NCBI 保持一致。每个物种的观测总量(log10)显示在最外圈的红绿环中。 绿色表示低观测量 , 红色表示高观测量 。
There are a few visible trends from the figure:
- Nearly half of the species recorded are within Nymphalidae;
- Half of the Lycaenid species are observed monotypically in their genus;
- Hesperiidae represents about 1/8 of the observations, but comparatively, each species has fewer records. i.e. no observation hotspots!
从图中可见几点明显的趋势:
- 将近一半记录到的物种在蛱蝶科;
- 有一半的灰蝶是对应属中唯一的记录;
- 虽然记录到的弄蝶物种占了1/8,但是平均每种的观测量较其他科偏少(即:没有观测的热点物种)。
 (Open the image in a new tab to view under higher resolution. 可在新页面中打开图片查看原图)
Here is a summary of 50 most observed species in the database. Note that not a single Hesperiidae is included! Unsurprisingly, Pseudozizeeria maha stands out as the most observed species, closely followed by Papilio polytes and other common species.
下图显示的是观测记录前50名的蝴蝶物种。其中居然没有一个弄蝶!酢酱灰蝶毫无意外地登顶(实在是太多了),玉带凤蝶和其他常见种紧随其后。

Distribution of the records through space
记录在空间上的分布
For visualization folks, here is just another map of the records distributed across the Mainland China. Each black dot is a single observation record, and its spatial density is estimated from QGIS (1 degree radius) as a heat map. Although these records encompass a wide-range of geographic localities as far as Western Xinjiang, most records are from a number of metropolitan areas: the Shanghai-Hangzhou-Nanjing triangle, Guangzhou-Shenzhen, Beijing, Changsha, Kunming, Chengdu. Two top hotspots, however, are of distinct reasons: the one at Xishuangbanna (lower left in Yunnan) is probably due to multiple active users from Xishuangbanna Tropical Botanical Garden; the Hainan hotspot is entirely contributed from our member thelittleman, who holds a steady observation site in Sanya. This partially explained why many of the popular species are of (sub)tropical origin!
下图是观测记录在中国大陆/内地的地理分布情况。每个黑点代表一个观测记录,其空间分布的密度(半径1度)由 QGIS 估测,我们把它画成一个热度图叠加在上面。虽然这些记录乍一看来自中国许多地方,但是考虑其相对数量后,其实集中在几个主要的城市区间:长三角、珠三角、北京、长沙、昆明、成都。此外,密度最高的两处有其独特的原因:云南最南端西双版纳热带植物园的许多用户贡献了当地大量的热带蝴蝶数据,而海南岛的热点完全是因为我们的成员 thelittleman 长期在三亚上传记录所致。这也部分地解释了为何观测到的常见物种中有相当一部分的(亚)热带物种。
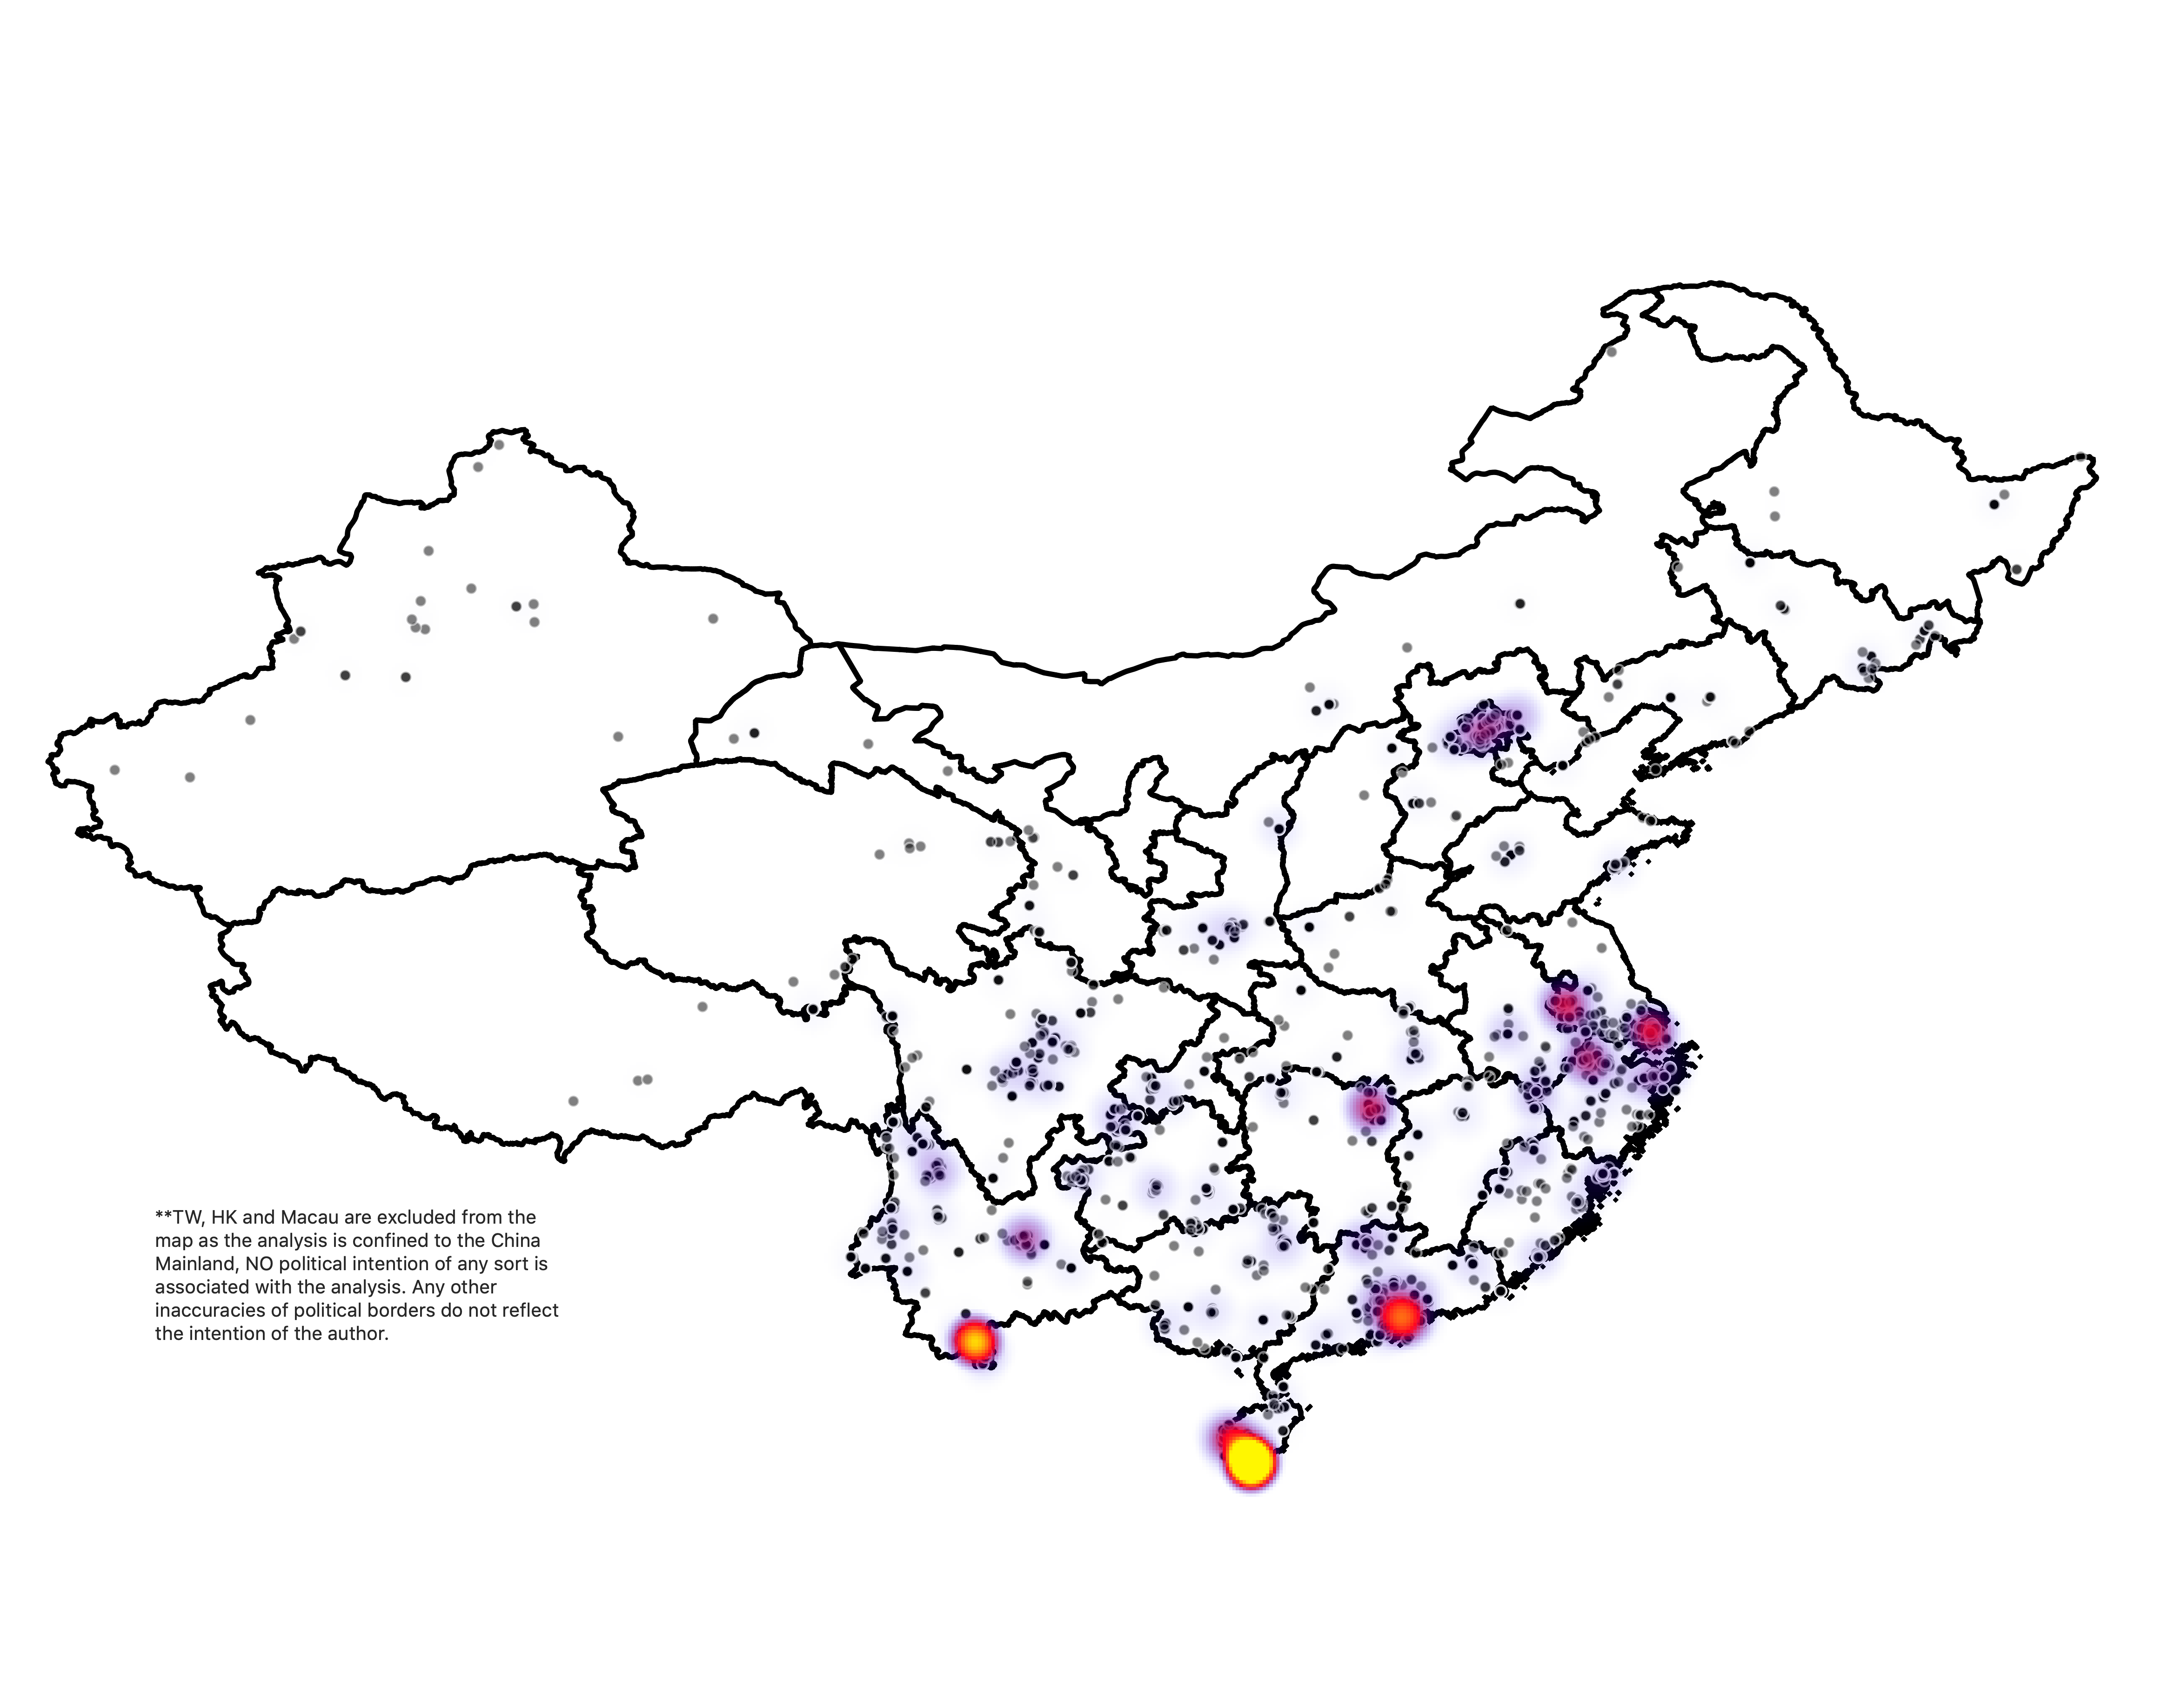 Spatial distribution of all the observations. (*please see the disclaimer for border issues*)
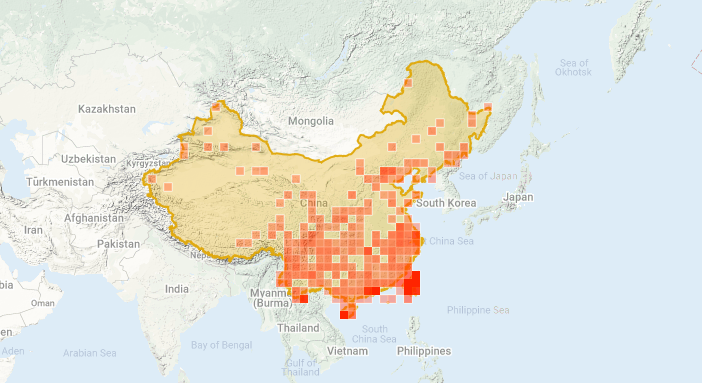
Compare with the image generated by iNaturalist (with HK, TW and Macau):
Conclusion and further note
There are a number of things to consider before starting to believe any of our conclusions is true:
- Are our data large enough to be statistically powerful?
- Any significant observer bias because a few members are a bit too active (in a good way, certainly:)?
- Are there false identifications that are not discovered by all the identifiers?
- Is our coverage of the geographic sites and phylogeny meaningful to generalize to larger areas?
The only way to mitigate these negatives would be to recruit more interested people to participate, identify, and discover together. I feel very grateful that a number of friends, some of whom I have only known over the Internet, are willing to share their photos with great generosity to this platform, I want to say a big “thank you”!
Finally, as the nature of iNaturalist is a portal rather than some private research facility, anybody can start his/her own project and analyze the data, as long as you cite it properly. It is both fun and educative, so why not give it a try?
As for the future plan of this specific project, I will still try to update the summary in a once-or-twice-a-year fashion. I am going to make the report as publically available as possible, as anything going into academic journals is likely going to be too boring to write and read!
在开始相信前面提到的结论是真的之前,有一些细节还需斟酌一下:
- 用来分析的数据集是否已经大到有足够的统计效果呢?
- 是否因为部分用户过于活跃导致记载的数据有偏差(当然,活跃是最好的:)?
- 是否有所有鉴定人都没有发现的鉴定错误?
- 记录涵盖的地理区域是否足够多样,广阔,均衡?
消除这些问题的办法,不外乎是邀请更多有兴趣的自然爱好者加入 iNat, 增加鉴定量,一起探索。我们还处于数据收集、整理的早期,尤其对大陆/内地的许多同学来说iNat这个站还有些冷门,也不方便访问。所以,对于一部分我只在网上认识的朋友能够上传许多他们拍摄的蝴蝶照片到这个平台里,我想说一声谢谢!
最后,iNat 作为数据传输平台,本身并非研究机构,每个用户都能够建立、管理自己的项目,也能够分析上面的数据(只要妥善地引用即可)。这件事寓教于乐,值得尝试。
关于这个项目未来的走向,我仍然会以每年1到2次的频率发布总结,而且这些总结都一定会是公开的。
References 引用文献
- Wu, C.S. and Hsu, Y.F., 2017. Butterflies of China. Fuzhou: The Straits Publishing House.
- iNaturalist. Available from https://www.inaturalist.org. Accessed Apr-03-2020.
- Bezanson, J., Karpinski, S., Shah, V.B. and Edelman, A., 2012. Julia: A fast dynamic language for technical computing. arXiv preprint arXiv:1209.5145. (All simple plots are generated by Julia 1.3)
- Letunic, I. and Bork, P., 2019. Interactive Tree Of Life (iTOL) v4: recent updates and new developments. Nucleic acids research, 47(W1), pp.W256-W259. (Tree generation)
- QGIS Development Team (YEAR). QGIS Geographic Information System. Open Source Geospatial Foundation Project. http://qgis.osgeo.org (Spatial map)